


In Groundhog Day, Bill Murray plays Phil Connors, a weatherman who wakes each morning to find himself back where he started: the same radio song at 6am, the same people, the same conversations and the same sequence of events.
As we approach another Budget, the premise feels strangely familiar.
Once again, we are told this is an important Budget. Once again, there is a fiscal hole to fill and difficult choices to be made. And once again, speculation is mounting. The Government faces competing demands to fund defence, welfare and social care. External events (this time the war in Iran and rising energy costs) are again eroding its fiscal headroom. And again, there is a need to reassure the bond markets.
Right on cue, the headlines have also found their high-profile departures – Rokos and Reuben amongst them.
Perhaps none of this should surprise us. We have had a succession of Chancellors of the Exchequer since 2020. Only my beloved Spurs have come close, with nine managers over the same period, and rival fans rarely miss an opportunity to highlight our misfortunes. A little stability in either dugout would be welcome.
The film Groundhog Day takes its name from a real American tradition. Every February, Punxsutawney Phil, a groundhog in Pennsylvania, is asked to predict the arrival of spring. If he sees his shadow, there will be six more weeks of winter; if not, spring is on its way. Sadly, like much of the speculation that has filled newspaper columns and TikTok reels over the last few weeks, Phil is rarely right.
If I am trying to be an optimist, this time it may be a little different. The new Prime Minister has promised a “circuit breaker” and appears willing to tackle some of the traditional third rails of British politics, from the triple lock to social care, even welfare reform. The government has also been clearer than its predecessors ahead of the Budget, showing a willingness to rule out some of the more damaging speculation rather than allowing it to gather momentum: the Prime Minister has ruled out SDLT reform at this Budget, while the Chancellor has reportedly ruled out an increase in CGT rates.
The recent intervention by the IMF may also prove telling. Unusually, the IMF said the UK stands out for having already started a consolidation process, with a clear plan to reduce borrowing. It recommended “staying the course” rather than accelerating spending cuts or tax rises. At the same time, the IMF upgraded its UK growth forecast. With the bond markets watching, that is a strong signal for the Chancellor to resist anything that looks like fiscal loosening, and perhaps another reason to expect a cautious, incremental Budget rather than a radical one.
An orderly transition
As I find myself once again putting pen to paper for this Autumn Buyside, I can imagine that some avid readers may start to feel that I sound like the radio breakfast DJ in the film: same song, same cheerful narrative, year in, year out. They may have a point!
The reality is that over the last decade, residential property in prime central London has undergone a prolonged period of adjustment, rather than a dramatic or disorderly correction. Values have softened, transactional activity has fluctuated and the market has adapted to an enduring cycle of uncertainty and a changing tax and political landscape. That it has done so without the short, sharp volatility of less mature markets is perhaps the clearest testament to its depth.
The best illustration is London’s journey through the UBS Global Real Estate Bubble Index. In 2015, the London market was ranked #1 and described as “by far the most overvalued in Europe”. A decade later, London ranked 20th of the 23 cities assessed and was said to be in “low bubble-risk territory”, having recorded the weakest price performance of any indexed city over the same period. Had we known a decade ago that London could make such an orderly transition, I suspect many of us would have welcomed it.
2026: the numbers tell the story
And what of 2026? So far this year, we have tracked 78 transactions over £10m, only marginally behind the 83 recorded at the same point last year and just 17% below the average since 2014.
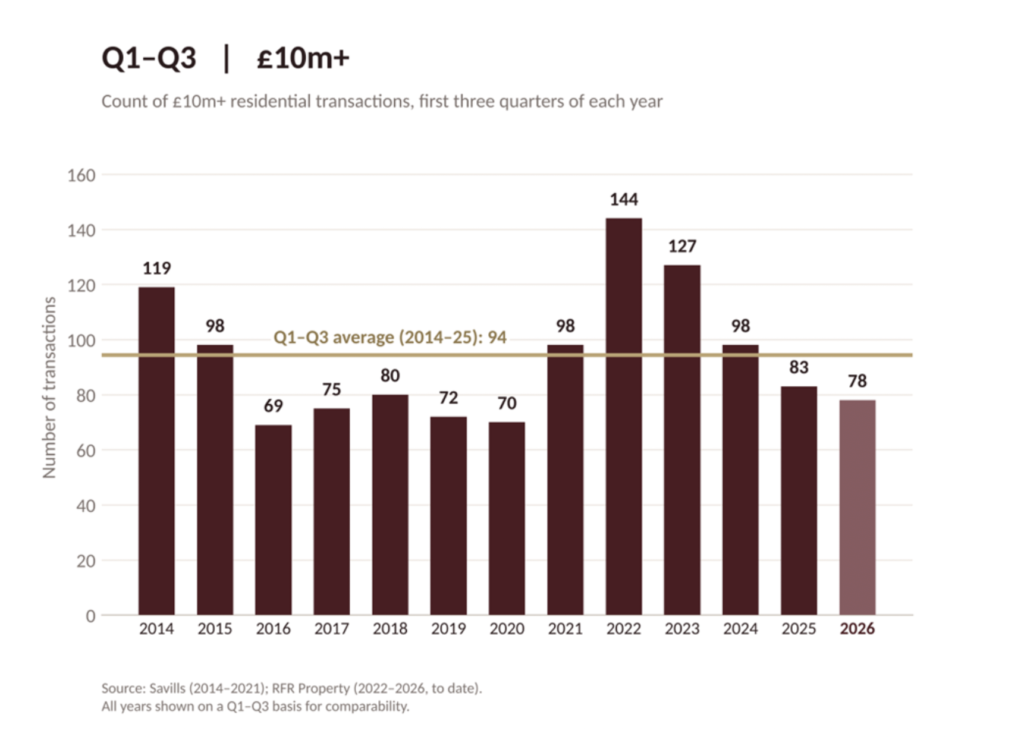
Given the prevailing narrative, that might come as a surprise to many, particularly those commentators who seem determined to write London’s obituary.
Of course, behind that single statistic is a market that has ebbed and flowed as the year has progressed. In the first half of 2026, transactions between £10m and £20m were 13% ahead of the long-term average, recording their fifth strongest first half since 2014. Conversely, transactions over £20m were nearly 50% below the long-term average, making it the weakest first half for that segment since 2014. By Q3, however, the picture had reversed. Transactions between £10m and £20m fell to 50% below the long-term average, making it one of the weakest third quarters since 2014. Meanwhile, the £20m+ market rebounded, with activity broadly in line with its long-term average. Interestingly, Q4 has begun with what feels like a flurry of activity, both from new buyers entering the market and in offers being made. Time will tell whether this translates into a strong final quarter.
Trying to make sense of quarter-to-quarter swings is perhaps a fool’s errand. They can simply reflect the natural rhythms of the market, a quieter summer period or the timing of individual transactions. No doubt this year’s geopolitical events, political uncertainty and movements in interest rates have also played their part. It is a useful reminder of the dangers of drawing sweeping conclusions from relatively short periods of transactional activity.

Location, location, location
Geographically, North London has stood out from the data. Regent’s Park, Primrose Hill and St John’s Wood had already exceeded last year’s full-year transaction volumes by the end of Q3, with activity looking set to finish ahead of both 2024 and 2025. This is a theme we first highlighted in our Q1 Buyside Built on Rock. An earlier reset in vendor expectations appears to have helped unlock liquidity in those neighbourhoods, with a number of properties that had been on the market for some time finally finding their value and their buyers. Perhaps unsurprisingly, almost all trades were houses, although the recent launch of St John’s Wood Square, led by Sir George Iacobescu, could shift that balance towards apartments in the year ahead.
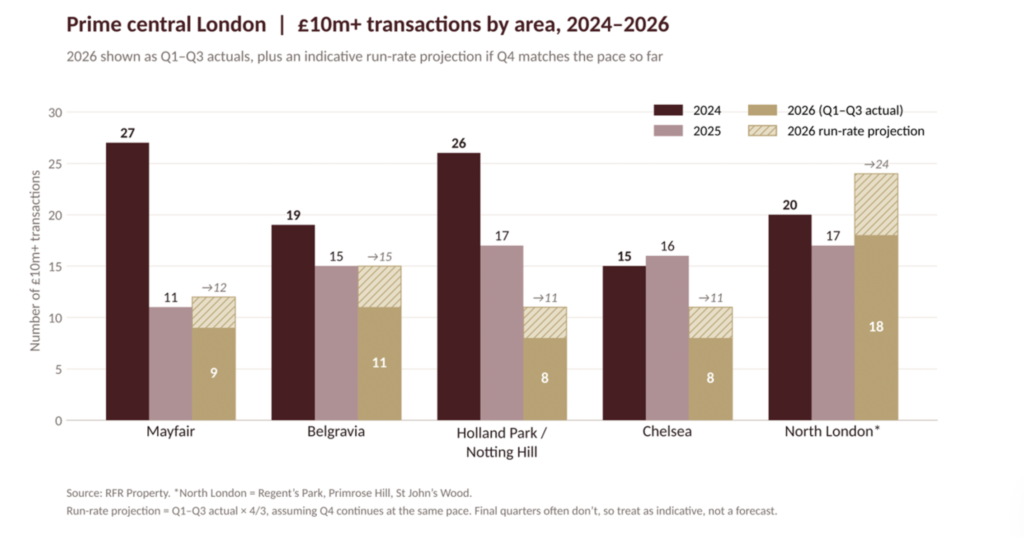
Belgravia and Chelsea have been consistent, although both will need a stronger final quarter to match last year’s volumes. Mayfair presents a different picture: although transaction volumes may finish ahead of 2025, they remain substantially below 2024 levels. Part of the explanation lies in the reduced pipeline of super-prime new build developments, which we return to later, alongside weaker demand for pieds-à-terre in the current tax and political environment.
Perhaps the greatest slowdown has been in Holland Park and Notting Hill, where transaction volumes are running at little more than a third of 2024 levels. There are of course a number of factors at play, from the exceptional strength of demand in earlier years (which drove up values) to a shortage of good quality stock, indicative of owners with special homes holding on to their treasures.
The picture, then, remains highly localised. Prime London is not a single market, but a series of distinct submarkets, each responding differently to changes in demand, sentiment, supply and pricing. Higher transaction volumes do not necessarily signal rising values, just as weaker activity does not always point to falling prices. In many cases, it is simply a question of where an individual market sits in its own cycle of adjustment.

Beyond the indices
Our transactional data does not seek to measure market-wide movements in property values. Having assessed the value of dozens of properties in the course of advising clients on acquisitions this year, we are very clear that value remains fundamentally property-specific. Market indices may tell us something about the direction of travel, but remarkably little about the value of any particular property.
Savills estimates that prime London values have fallen 26% since 2014 whilst Knight Frank suggest a fall of 22% since 2015. Over the past twelve months, they report falls of 5% and 2% respectively, although, in a rare ray of sunshine, Knight Frank recorded growth of 0.3% in Q3.
As regular readers of The Buyside will know, we have long commented on the bifurcation of our market, both in terms of value and liquidity. There is no doubt that values have fallen, but those declines have been far from uniform. Good stock, particularly turnkey properties, remains scarce at every price point, and that scarcity continues to support values for the best properties. Few active market participants would suggest that best-in-class properties have fallen 26% since 2014. Indeed, some continue to set records, often attracting fierce competition. One tier down, however, vendors have had to recalibrate expectations, in some cases back towards 2012 levels. For properties that are materially compromised or otherwise blighted, it can be difficult to identify a market at all.
Quality therefore goes to the heart of both value and liquidity. Crucially, this distinction exists at every price point and in every segment of the market. It is also something that modelling, indices and, increasingly, AI can struggle to capture. The same challenge may arise with the Government’s proposed council tax surcharge valuations, where broad £psf assumptions, and data-driven adjustments, risk overlooking the quality of an individual property.
Distress remains limited and more apparent among compromised properties, especially where debt is involved. There also remains little pressure on many owners to sell. We recently advised a client considering the sale of a rare, turnkey lateral apartment, inviting three leading selling agents to submit proposals. Having considered their advice and likely achievable prices, the client decided to hold. Having invested considerable time, effort and capital in creating an exceptional home, they saw little reason to sell at the levels suggested by the agents, despite rarely using the apartment and having no need to retain it.
The example illustrates a wider challenge: owners of the very best properties are often those with the least need to sell. If the market will not recognise the value they place on their property, they can simply wait. The result is a familiar circularity: constrained supply supports values for the best properties, while buyers searching for quality continue to find relatively little of it.
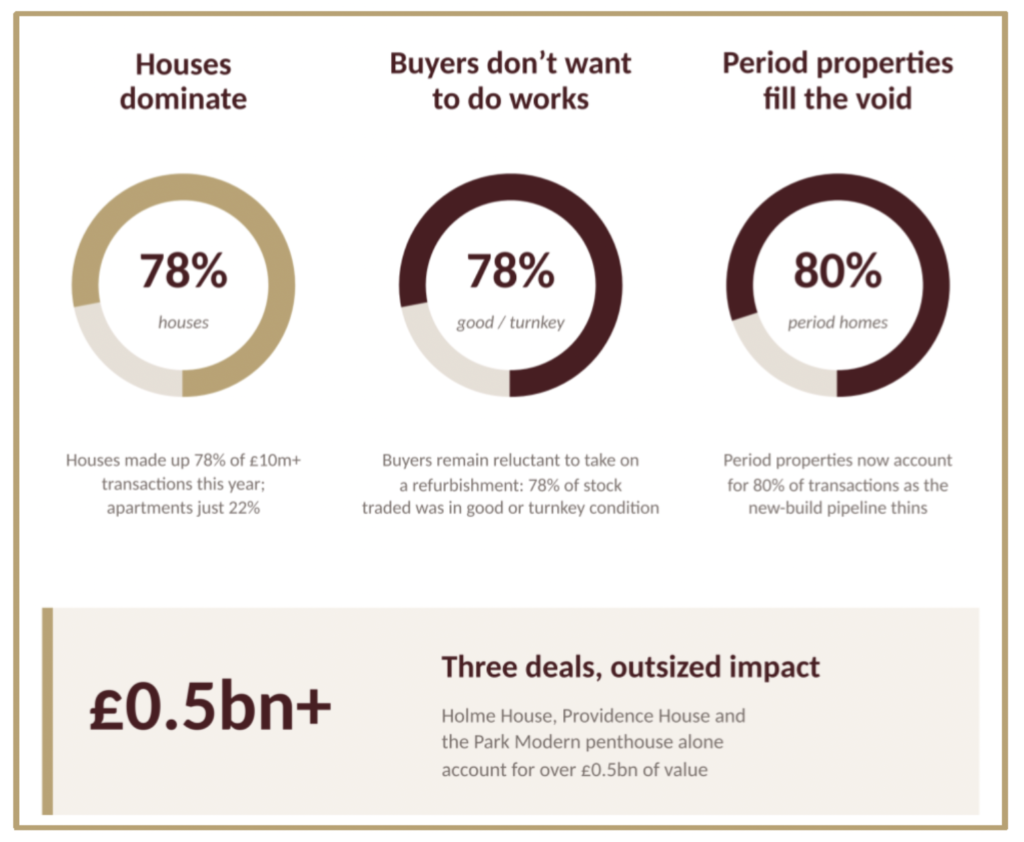
A note of caution when interpreting the year’s aggregate transaction values: three exceptional transactions – The Holme, Providence House and the Park Modern penthouse – alone account for more than £0.5bn of activity, including two of London’s largest ever transactions. These are undoubtedly positive for London, but they will also have a disproportionate influence on the year’s total value. When the inevitable year-on-year comparisons emerge, it will be important to remember how much of the aggregate value is attributable to these three transactions, rather than to activity across the wider market.

Other trends from our data
Beyond transaction volumes and values, several long-established trends have become even more pronounced: the preference for turnkey properties, which emerged during lockdown and has persisted ever since, continues to strengthen; houses (as opposed to apartments) now account for 78% of transactions above £10m; and period properties also dominate, accounting for 80% of transactions – a figure that reflects, at least in part, the continued contraction of the new-build pipeline.
Domestic and US buyers remain important drivers of activity, with non-resident buyers particularly active at the very top of the market.
Privacy is becoming increasingly important. We have commented before on the growing emphasis buyers place on confidentiality, but the trend has become more pronounced. Not so long ago, social media exposure and even television programmes seemed to be the direction in which the industry was heading. Thankfully, our experience is that neither owners nor buyers want their acquisitions publicised, their homes photographed or their personal information widely shared. They want advisers they can trust to exercise discretion throughout the process. Given our legal backgrounds, confidentiality has always been fundamental to how we operate, but it is striking how much more important it has become to buyers.

Poacher turned gamekeeper
One trend that warrants closer examination is the changing composition of London’s £10m+ new-build market. With the development pipeline having fallen by more than 80% since 2014, the choice available to buyers has narrowed dramatically.
Only a few years ago, a buyer seeking a large family apartment could choose from more than a dozen exceptional developments, including: No. 1 and Twenty Grosvenor Square; Clarges; The Peninsula; The Glebe; The OWO; The Whiteley and Chelsea Barracks. Today, that choice is largely concentrated in just four schemes. With little prospect of a meaningful recovery in the development pipeline, the secondary market – the resale of apartments in completed schemes – is becoming increasingly important. Indeed, secondary transactions have accounted for nearly a third of the new-build market so far this year.
It is therefore particularly timely that Hamish Eggins has joined RFR as Managing Director. A former Partner at Knight Frank, Hamish is widely regarded as one of London’s leading experts in super-prime residential development, having advised on nearly every major scheme in the capital. His understanding of the schemes, the individual apartments, their original pricing and the developers behind them adds a formidable depth of expertise to our existing team.
In our next edition of The Buyside, we intend to examine the new-build pipeline and the emergence of the secondary market in greater detail. We will explore what our transaction data tells us about values, where premiums have endured and where they have not, and why understanding the differences between schemes – and indeed individual apartments within them – is so important for buyers.

Groundhog Day – again?
And so we return to the familiar cycle of speculation, uncertainty and apprehension. The list of potential tax and policy changes seems endless, each capable of influencing sentiment, supply or demand, some by design and others as collateral damage. With the electorate divided and the country’s political direction far from settled, there is little reason to expect that uncertainty to disappear any time soon.
Yet, while the political narrative has donned a familiar, negative tone, the market has quietly adjusted. Values have fallen, although far from uniformly, and demand has endured, albeit ebbing and flowing through successive periods of uncertainty. At the same time, the supply of exceptional homes, particularly turnkey properties, has become increasingly constrained. A more settled political and fiscal environment would undoubtedly release some blockages, but London’s enduring strengths may also become increasingly relevant in a world facing profound geopolitical, technological and economic change. Combined with the continued creation of international wealth, these factors could provide a more supportive backdrop for demand and, in time, values. Whether and when that happens remains to be seen.
For now, it feels as though we are stuck in our own version of Groundhog Day. According to the film’s director, Bill Murray’s character spent some 30 to 40 years reliving the same day on a loop – though the initial draft scripted the duration at a staggering 10,000 years. After more than a decade of political and fiscal uncertainty, let’s hope London doesn’t take quite so long to break the cycle.